Web Tool API
Uploading Data
There are two ways to upload data into dms-viz. You can either upload a local specification file from your computer, or you can provide a link to a remote specification file hosted somewhere like GitHub. You'll find the options for uploading data under the Upload Data section of the side menu.
Local
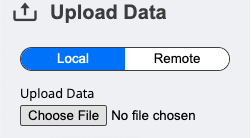
To upload a local file, you simply click on the Upload Data section and choose a file from your machine.
Remote
Alternatively, if your raw .json file is hosted somewhere online – like on GitHub, for example – you can provide the link to this file by clicking on the Remote button under the Upload Data section.
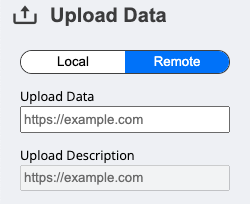
You can try it yourself by pasting the following link into the URL text box:
https://raw.githubusercontent.com/dms-viz/configure_dms_viz/main/tests/sars2/output/sars2.jsonhttps://raw.githubusercontent.com/dms-viz/configure_dms_viz/main/tests/sars2/output/sars2.jsonThis approach has some advantages. For example, after providing a link to your data, this link is saved in the URL, allowing you to share a view of dms-viz with the data pre-loaded and ready to view. Also, this approach allows you to provide a markdown description (also hosted remotely) of the datasets.
Providing A Description
If you've uploaded data that's stored on a server like GitHub by following the Remote instructions, you can optionally provide a link to a markdown (.md) file that will be displayed below the main visualization in a collapsible container.
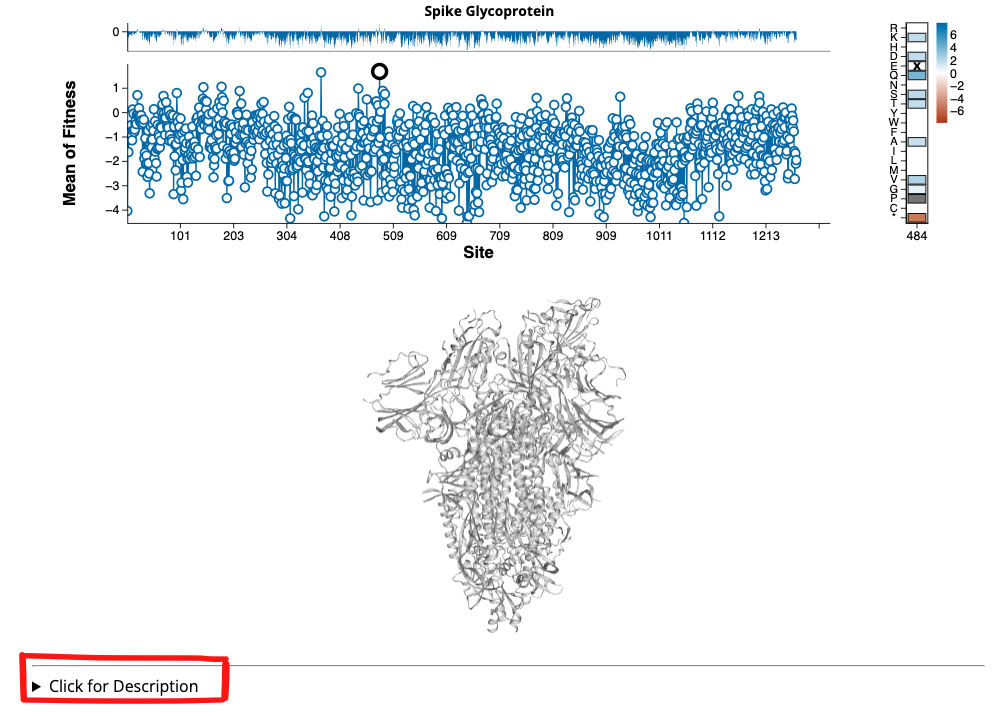
Just like the remote .json specification, the link to the markdown is saved in the URL path and the description will load automatically when someone accesses the updated URL.
Chart Configuration
dms-viz provides a handful of ways to navigate and customize the visualization. You can find these options under the Chart Options tab in the side menu.
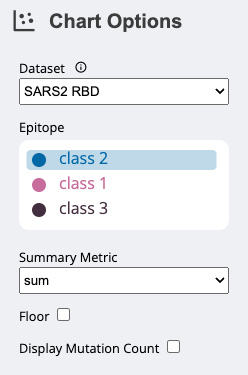
DatasetAlthough
configure-dms-vizwill return only a single.jsonspecification, it is possible to combine multiple.jsonspecifications in a single file to visualize. If there are multiple datasets in the.jsonfile, you can navigate between these using theDatasetdropdown menu. The name that appears in the dropdown for each dataset depends on the--nameflag.Additionally, next to the
Datasetdropdown menu there is an information icon ⓘ. By clicking on this icon, a short description of the dataset appears above the top plot. The description can be specified using the--descriptionflag.ConditionIf your input data has multiple measurements for each mutation/site combination that are distinguished by some condition (specified by the
--conditionflag), an interactive legend appears underChart Options.Although the default label that appears above the legend is
Condition, you can specify the label using the--condition_nameflag.Summary MetricUse the
Summary Metricdropdown menu to choose how to summarize themetricacross every mutation at each site. Choose between themean,min,max, andsum. The resulting summary is displayed in the line plot and on the protein structure.FloorUse the
Floorcheckbox to choose whether the data should be floored at 0.Display Mutation CountUse the
Display Mutation Countcheckbox to replace the summary plot above the line plot with a density plot showing the number of mutations that have been sampled at each site. For example, if four mutants have been observed at site 10 in the protein (A,T,Q, andM), the height at that site will be four.
Protein Configuration
dms-viz provides a handful of ways to navigate and customize the 3D protein structure. You can find these options under the Protein Configuration tab in the side menu.
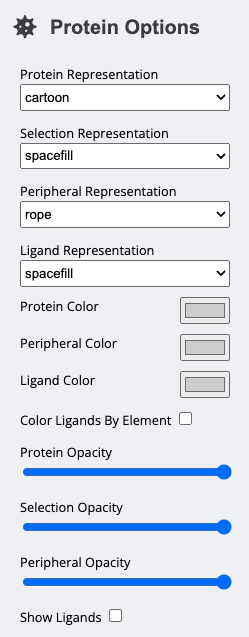
There are four components of the protein structure whose appearances can be controlled separately. For each of these separate components, you can alter the color, representation, and opacity.
| Component | Description |
|---|---|
Protein | All 'polymer' chains in the protein structure that have corresponding data (included in the --included-chains flag). |
Selection | The residues in Protein that have been selected by the user. |
Peripheral | The chains that are aren't excluded (by the --exclude-chains flag) but don't have corresponding data (aren't included in the --included-chainss). |
Ligand | If Show Ligands is checked, the ligands (i.e. glycans, small molecules, etc...) in the structure. |
For each of these separate components, there are options to change the following:
RepresentationHow the structure is represented (i.e.
surface,ball and stick, etc...).ColorThe color of the molecules. All of the molecules for a given component will be the same color, however, ligands can be colored by element.
OpacityThe opacity of the component. This can help illustrate the molecular structure with the
metricsuperimposed on the surface of the protein.
Interaction
There are a multitude of ways to interact with dms-viz. Below, you'll find some examples of what this interaction can look like.
Chart
You can zoom in and out of regions of your data by brushing (click and drag) over the area plot.
You can mouse over sites on the line/point and mutations on the heatmap to see details in a pop-up tooltip and you can select sites to see in the heatmap by clicking on points in the line/point plot.
You can select sites on the protein structure by brushing (click and drag) over points in the line/point plot.
To deselect sites, you can either double-click on the line/point plot or hold down the option key ⌥ and brush over the sites that you want to deselect.
If there is more than one condition in your data, an interactive legend will appear in the Chart Options You can select a condition to color the protein structure with by clicking on a condition in the legend.
Finally, you can remove or add conditions to the line/point plot by holding down the option key ⌥ while clicking.
Protein
You can reorient and zoom into the protein structure by clicking and dragging it around the window. You can also reset the protein structure to its original orientation by pressing the R button on your keyboard.
Sharing
The visualizations that you create with dms-viz can be shared with collaborators and in manuscripts. There are three ways to go about this:
1. Share the .json file
You can simply share the .json specifications that you create with configure-dms-viz.
2. Share static images
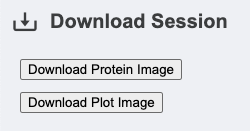
If you're only interested in a particular plot or protein, you can save and download .png images. Under the Download Session tab in the side menu, you'll see buttons to download an image of both the plot and the protein.
3. Share the URL links
If your data is hosted on a remote server like GitHub, you can copy the link from your session. This link keeps track of your data, an optional description, and all of the configuration options that you've selected.
 dms-viz