Getting Started
Overview
dms-viz requires two steps:
First, using a command line tool called
configure-dms-viz, you specify information about your dataset to generate a.jsonspecification file.Second, you open up the web tool and upload your
.jsonspecification file to generate an interactive visualization. Below are some instructions to get you oriented.
Want to Skip Ahead?
If you're interested in the detailed command line API, check out the reference here. If you've already formatted your data and you're ready to start visualizing it, check out the instructions for that here.
Prerequisites
To use dms-viz with your data, you'll need to install the command line tool configure-dms-viz. To use configure-dms-viz, you must ensure that you have the correct version of Python (3.9 or later) installed on your system.
If you are unsure whether the correct version of Python is installed, open a terminal window (Command Prompt in Windows, Terminal in macOS, or a terminal emulator in Linux) and run the following command:
python --versionpython --versionCheck the version number that is displayed. It should be 3.9.x or later. If the command isn't recognized or the version is earlier than 3.9, you will need to install or update Python.
To install configure-dms-viz, you'll also need the package manager pip. Here's how to check if pip is installed and how to install it if it isn't. In the terminal window, run the following command:
pip --versionpip --versionIf pip is installed, the version number will be displayed. If it is not installed, you will see an error message. If pip isn't installed, follow these instructions to install it.
Installation
Currently, configure-dms-viz is distributed on PyPI, allowing you to install configure-dms-viz using pip. To install the latest version of configure-dms-viz, run the following command in the terminal:
pip install configure-dms-vizpip install configure-dms-vizNow, configure-dms-viz should be installed. You can double-check that the installation worked by running the following command in the terminal:
configure-dms-viz --helpconfigure-dms-viz --helpYou should see the help message for the tool printed to the terminal's output.
Basic Usage
configure_dms_viz is a command-line tool designed to create a .json format specification file for dms-viz. You provide the data that you'd like to visualize along with additional information to customize the visualization. The resulting specification file is then uploaded to dms-viz to create the visualization of your data. Below is an overview of the process of using configure_dms_viz.
Looking for more details?
This example only covers the basic use case. You can augment dms-viz with custom tooltips, filters, and more. For a detailed explanation of these features, check out the reference here.
configure-dms-viz has two commands, format and join. To format a single dataset for dms-viz, you execute the configure-dms-viz format command with the required and optional arguments as needed:
configure-dms-viz format \
    --name <experiment_name> \
    --input <input_csv> \
    --metric <metric_column> \
    --structure <pdb_structure> \
    --output <output_json> \
    [optional_arguments]
configure-dms-viz format \
--name <experiment_name> \
--input <input_csv> \
--metric <metric_column> \
--structure <pdb_structure> \
--output <output_json> \
[optional_arguments]The required arguments are:
--name: The name of your dataset as you'd like it to appear in the visualization.--input: The file path to your input data.--metric: The name of the column that contains the metric you want to visualize.--structure: The protein structure that you want to use as a model.--output: The file path of the output.jsonfile.
The remaining arguments are all optional and configure the structure, appearance, and interaction of your final visualization. For more details on the individual arguments, check out the API reference.
Before going any further
If you plan to use configure-dms-viz, it's crucial that you familiarize yourself with the input data requirements. Please check out what these requirements are here.
Now, let's use configure-dms-viz with a minimal example. This data is included in the GitHub repository. If you want to follow along, clone the repository and run configure-dms-viz from the top of the directory.
Input
configure-dms-viz format \
   --name "REGN mAb Cocktail" \
   --input tests/SARS2-RBD-REGN-DMS/input/REGN_escape.csv \
   --sitemap tests/SARS2-RBD-REGN-DMS/sitemap/sitemap.csv \
   --metric "mut_escape" \
   --metric-name "Escape" \
   --structure "6XDG" \
   --included-chains "E" \
   --condition "condition" \
   --condition-name "Antibody" \
   --output ./REGN_escape.json
configure-dms-viz format \
--name "REGN mAb Cocktail" \
--input tests/SARS2-RBD-REGN-DMS/input/REGN_escape.csv \
--sitemap tests/SARS2-RBD-REGN-DMS/sitemap/sitemap.csv \
--metric "mut_escape" \
--metric-name "Escape" \
--structure "6XDG" \
--included-chains "E" \
--condition "condition" \
--condition-name "Antibody" \
--output ./REGN_escape.jsonHere, we've specified that we want the dataset to be called REGN mAb Cocktail (named after the Regeneron Antibody cocktail against SARS-CoV-2) and we've pointed to the input data containing scores detailing the degree of antibody escape from the REGN mAb Cocktail. We've also specified a sitemap that tells the tool how sites in your data correspond to the sites in the protein structure. Then, we specified that we wanted to use the protein structure 6XDG from the RSCB PDB website and only display our data on chain E of that structure. The column in the input data that contains our data is called mut_escape, and we have different values of mut_escape for the same mutations depending on the condition (in this case, the condition refers to escape from each antibody in the cocktail).
The result of this command should be a message printed to the terminal that looks like this:
Output
Formatting data for visualization using the 'mut_escape' column from 'tests/SARS2-RBD-REGN-DMS/input/REGN_escape.csv'...

Using sitemap from 'tests/SARS2-RBD-REGN-DMS/sitemap/sitemap.csv'.

'protein_site' column is not present in the sitemap. Assuming that the reference sites correspond to protein sites.

About 95.98% of the wildtype residues in the data match the corresponding residues in the structure.
About 4.02% of the data sites are missing from the structure.

Success! The visualization JSON was written to './REGN_escape.json'
Formatting data for visualization using the 'mut_escape' column from 'tests/SARS2-RBD-REGN-DMS/input/REGN_escape.csv'...
Using sitemap from 'tests/SARS2-RBD-REGN-DMS/sitemap/sitemap.csv'.
'protein_site' column is not present in the sitemap. Assuming that the reference sites correspond to protein sites.
About 95.98% of the wildtype residues in the data match the corresponding residues in the structure.
About 4.02% of the data sites are missing from the structure.
Success! The visualization JSON was written to './REGN_escape.json'This message provides some information from the configure-dms-viz format command for your dataset. In addition to this message, there will be a .json file located where you specified the output path.
This is how you use configure-dms-viz to format a single dataset. You can optionally combine multiple datasets into a single .json specification file using the configure-dms-viz join command which takes a list of .json files as arguments along with an optional description of the datasets. For more details on combining datasets, check out the API.
For now, since we're only visualizing a single dataset, we can skip this step. In the next section, you'll take this .json visualization file and visualize your data with dms-viz.
Visualizing
There are two ways to upload data into dms-viz. You can either upload a local specification file from your computer, or you can provide a link to a remote specification file hosted somewhere like GitHub.
Local
To upload a local file, you simply click on the Upload Data section and choose a file from your machine.
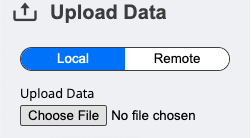
Since the .json file created above should now be stored locally on your machine, you can upload this file using this approach.
Remote
Alternatively, if your .json specification file is hosted somewhere online – like on GitHub, for example – you can provide the link to this file by clicking on the Remote button under the Upload Data section.
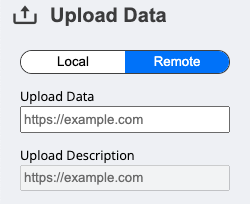
You can try it yourself by pasting the following link into the URL text box:
https://raw.githubusercontent.com/dms-viz/configure_dms_viz/main/tests/SARS2-RBD-REGN-DMS/output/SARS2-RBD-REGN-DMS.jsonhttps://raw.githubusercontent.com/dms-viz/configure_dms_viz/main/tests/SARS2-RBD-REGN-DMS/output/SARS2-RBD-REGN-DMS.jsonThis approach has some advantages. dms-viz includes the link to your remotely stored specification in the URL, allowing you to share your visualization with the data pre-loaded. Another advantage of this approach is that changes made to the appearance of dms-viz are saved in the URL as well.
For more details on using the web-based interface of dms-viz including hosting, interacting, and sharing your files, check out the interaction reference.